Computing spectrogram
To move from one type of signal to another, all the ModusaSignal should have different to_ methods.
[1]:
from modusa.io import AudioLoader
[3]:
# From file path
audio = AudioLoader.from_fp(
    "../../../../../music/songs/song.mp3")
audio = audio.crop(20, 40) # Taking first 20 seconds of the signal
audio.print_info() # Use this to print the details of the audio
--------------------------------------------------
Title               : song.mp3
Type                : Audio Signal
Duration            : 20.00 sec
Sampling Rate       : 48000 Hz
Sampling Period     : 0.0208 ms
--------------------------------------------------
[4]:
audio_fig = audio.plot()
[5]:
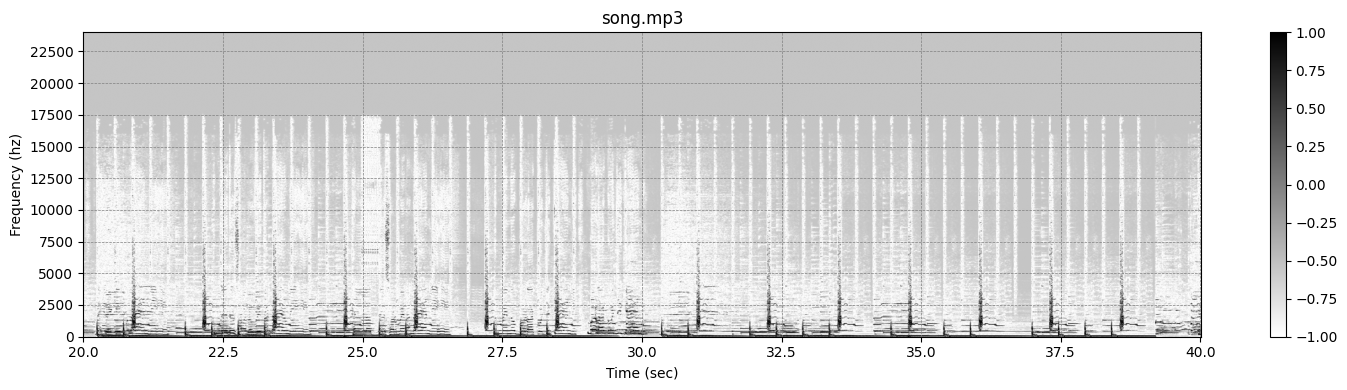
spec = audio.to_spectrogram()
[7]:
spec.print_info()
--------------------------------------------------
Title               : song.mp3
Kind                : Spectrogram
Shape               : (1025, 1876) (freq bins × time frames)
Frame Rate          : 93.75 (frames / sec)
Time resolution     : 0.0107 sec (10.67 ms)
Freq resolution     : 23.44 Hz
--------------------------------------------------
[8]:
spec_fig = abs(spec).plot()
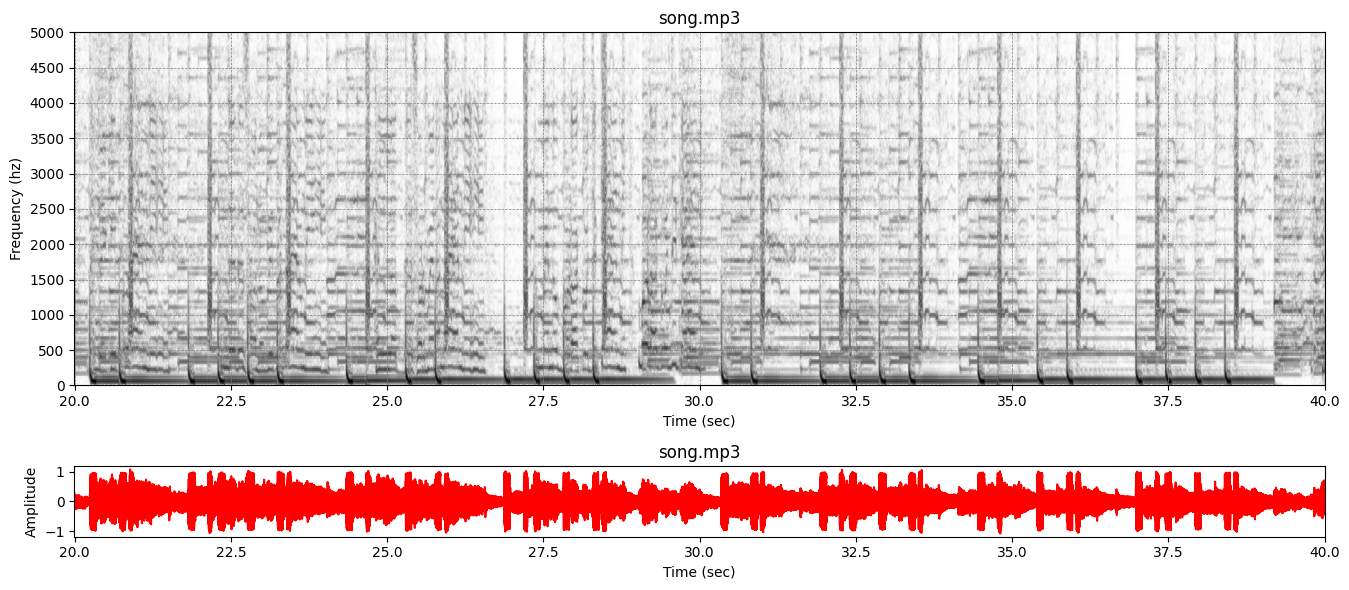
[10]:
import matplotlib.pyplot as plt
fig, axs = plt.subplots(2, 2, figsize=(14, 6), width_ratios=[1, 0.02], height_ratios=[1, 0.2])

# Share x-axis manually between first column (axs[0,0] and axs[1,0])
axs[0, 0].sharex(axs[0, 0])  # Now only first column shares x-axis
axs[1, 0].sharex(axs[0, 0])  # Now only first column shares x-axis

# Plot
(1 + abs(spec)).log().plot(ax=axs[0, 0], show_colorbar=True, cax=axs[0, 1], origin="lower", ylim=(0, 5000))
audio.plot(ax=axs[1, 0], fmt="r-")

# Clean up unused colorbar slot in bottom row
axs[0, 1].remove()
axs[1, 1].remove()

plt.tight_layout()
plt.show()
[11]:
((1 + abs(spec)).log() + 10).sin().plot()
[11]: