Plotting signals
Hopefully, based on the principles of the framework, .plot should be available to all the subclasses.
[1]:
from modusa.generators import AudioWaveformGenerator # Using this to generate audio signal for testing
[2]:
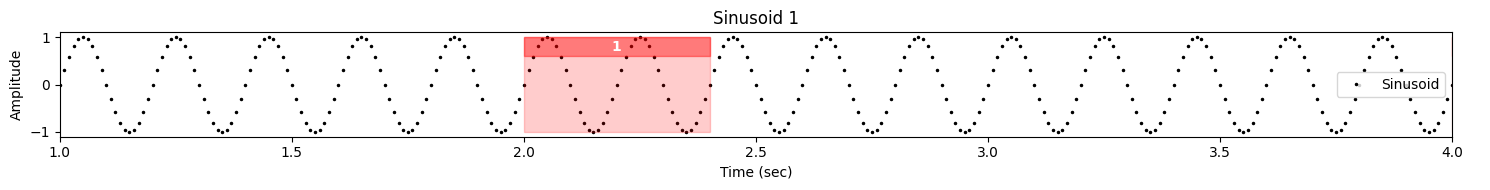
signal1 = AudioWaveformGenerator.generate_sinusoid(A=1, f=5, phi=0, sr=100, duration=5)
signal1.title = "Sinusoid 1"
[6]:
signal1.plot(xlim=(1, 4), highlight=[(2, 2.4), (4, 4.1)], fmt="k.", label="Sinusoid")
[6]:
[ ]: